
Reducing rows and columns
Since the first three rows don’t contain any meaningful data, we can remove them. In addition to filtering columns, the Power Query user interface offers the following options for row reduction:
- Keep Rows
- Keep Top Rows Keeps the specified number of top rows. Works on the whole table only.
- Keep Bottom Rows Keeps the specified number of bottom rows. Works on the whole table only.
- Keep Range of Rows Skips a specified number of top rows and then keeps the chosen number of rows. Works on the whole table only.
- Keep Duplicates Keeps rows that appear more than once. This option can work on the whole table, meaning all column values will have to match for rows to be considered duplicates, or it can work on selected columns only, so values will only need to match in specified columns for duplicates to be kept.
- Keep Errors Keeps rows that contain errors. This option can work on the whole table or selected columns only.
- Remove Rows
- Remove Top Rows Removes a specified number of top rows. Works on the whole table only.
- Remove Bottom Rows Removes a specified number of bottom rows. Works on the whole table only.
- Remove Alternate Rows Removes rows following a user-supplied pattern: it starts with a specified row, then alternates between removing the selected number of rows and keeping the chosen number of rows. Works on the whole table only.
- Remove Duplicates Removes rows that are duplicates of other rows. Can work on the whole table or selected columns only.
- Remove Blank Rows Removes rows that completely consist of empty strings or nulls. Works on the whole table only; if you need to remove blank values from a specific column, you can select the filter button to the right of a column’s name and select Remove Empty.
- Remove Errors Removes rows that contain errors. Can work on the whole table or selected columns only.
Since notes can potentially change, it’s best not to remove them by filtering out specific values. In our case, Remove Top Rows is appropriate, so we can perform the following steps:
Select Remove Rows on the Home ribbon.
Select Remove Top Rows.
Enter 3 in the Number of rows box.
Select OK.
Now that we have removed the top three rows, we can use the first row for the column names by selecting Use First Row as Headers on the Home ribbon. The result should look like Figure 1-25.
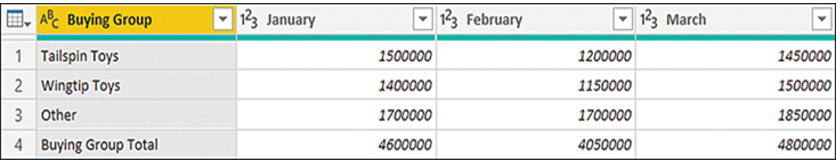
FIGURE 1-25 Targets for 2022 with unnecessary rows removed and headers in place
Note how Power Query automatically detected column types, this time correctly since only the first column is a text column and all the other columns are numeric.
Next, you can see that the last row is a total row, and the last column, Year Target, is a total column. You need to remove both, because keeping them may result in incorrect aggregation later in Power BI.
There are several ways to remove the last row, and which way is best for you depends on several factors:
- If you’re sure that the last row is always going to be a total row, you can remove it in the same way that you removed the top three rows earlier.
- If, on the other hand, you’re not sure that the total row is always going to be there, it’s safer to filter out a specific value from the Buying Group column—in our example, Buying Group Total.
- Depending on business logic, you can also apply a text filter that excludes values that end with the word Total. This kind of filter relies on actual Buying Group column values not ending with Total.
Important Case Sensitivity In Power Query
Since Power Query is case-sensitive by default, you must exclude the word “Total”; filtering out “total” won’t work.
Let’s say you’re sure that only the total row label ends with the word Total, so we can apply a corresponding filter to the Buying Group column as follows:
Select the filter button on the Buying Group column header.
Select Text Filters > Does Not End With.
Enter Total in the box next to the drop-down list that shows does not end with.
Select OK.
The last row is now filtered out, and you should remove the last column as well, since it contains totals for the year. To do so, select the Year Target column and press the Delete key.
With the totals gone, Power Query Editor should show “13 columns, 3 rows” in the lower-left corner. However, the current Targets for 2022 query still does not meet our goals because we don’t have a single date or month column. Instead, targets for each month appear in a separate column. We’ll address this issue next.